在R中以圆圈绘制弧度/度数
我难以生成圆的X,Y坐标,然后绘制线段。基本上我想做的是从圆心到圆的外侧以完美的间距绘制360条线。这就是我目前正在做的事情,但它无法正常工作。如果有不同的方法来做到这一点,那也很好用!我也希望0度从圆圈的左侧开始。
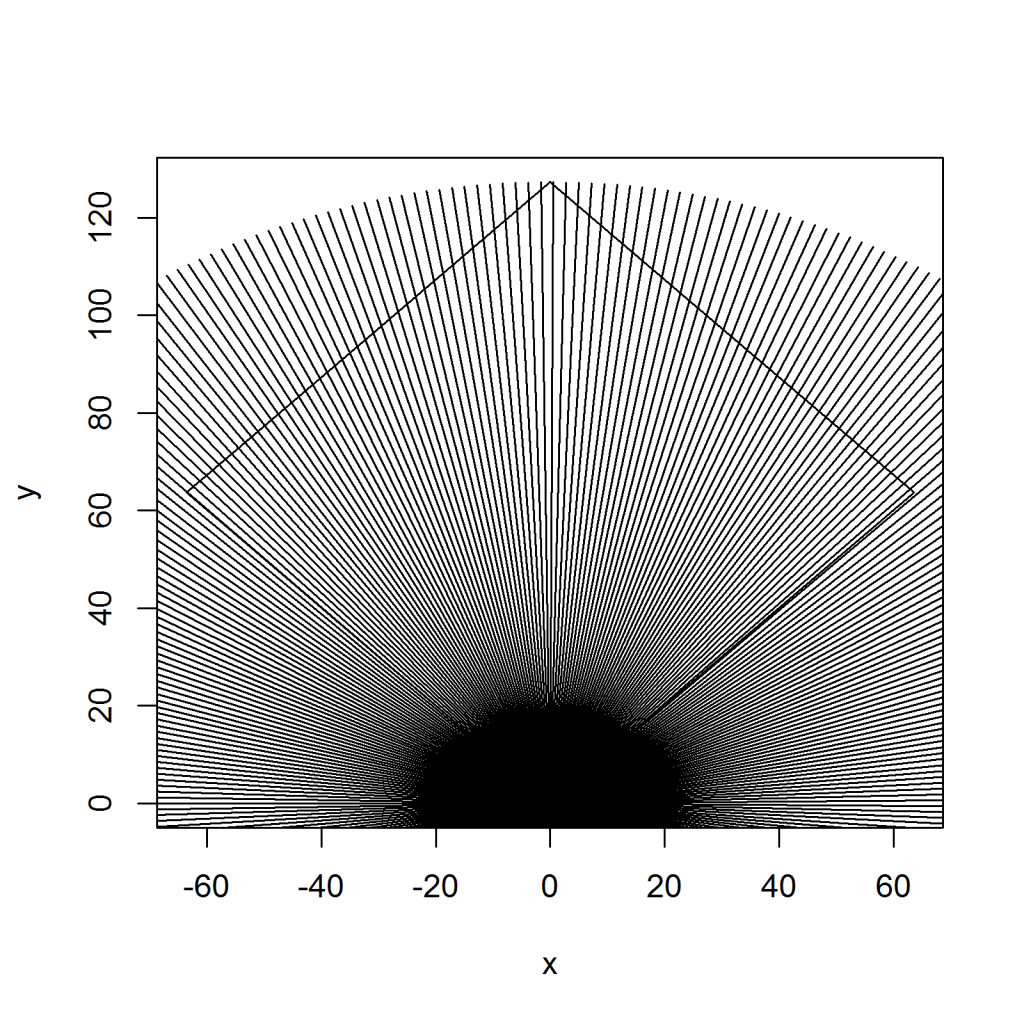
t <- seq(0,2*pi,length=360)
coords <- t(rbind( sin(t)*127.28125, cos(t)*127.28125))
plot(coords,type='n',xlim=c(-63.625625,63.625625),ylim=c(0,127.28125))
lines(coords)

deg=data.frame(coords[,1],coords[,2])
head(deg)
deg$count=1
deg$degree=1

for(i in 1:nrow(coords)){
if(deg$count[i]<=270){
deg$degree[i]=i-1+90-45
} else {
deg$degree[i]=i-1-270-45
}
}

names(deg)[1] <- "X"
names(deg)[2] <- "Y"

i=1
for(i in 1:19){
segments(0,0,deg$X[deg$degree==((5*(i-1)))],deg$Y[deg$degree==((5*(i-1)))])
cat(((5*(i-1))),'\t')
}
更新
我遇到了线条被绘制的问题。基本上当我们围绕圆圈时,误差变得更大,所以当pi / 2弧度发生并且它是直线上升时,该值略微在x = 0的右边。这可能是不可能的,但我想我会问,看看有没有解决这个问题! 45 90和135都应该在线上匹配。
1 个答案:
答案 0 :(得分:2)
这个怎么样
th <- seq(0, 2*pi, length.out=360)
r <- 2
x <- r*cos(th)
y <- r*sin(th)

plot(x,y, type="n")
segments(0,0,x,y)
基本上我在极地空间选择th和r并转换为笛卡儿。

如果您想从左侧的0开始,请使用
x <- -r*cos(th)
代替。
相关问题
最新问题
- 我写了这段代码,但我无法理解我的错误
- 我无法从一个代码实例的列表中删除 None 值,但我可以在另一个实例中。为什么它适用于一个细分市场而不适用于另一个细分市场?
- 是否有可能使 loadstring 不可能等于打印?卢阿
- java中的random.expovariate()
- Appscript 通过会议在 Google 日历中发送电子邮件和创建活动
- 为什么我的 Onclick 箭头功能在 React 中不起作用?
- 在此代码中是否有使用“this”的替代方法?
- 在 SQL Server 和 PostgreSQL 上查询,我如何从第一个表获得第二个表的可视化
- 每千个数字得到
- 更新了城市边界 KML 文件的来源?