如何使轮廓图在一个轴上的线图上不重叠?
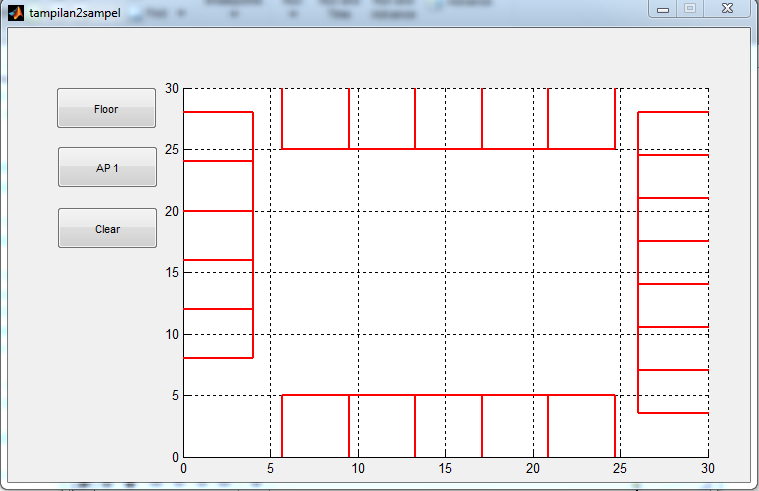
我在matlab指南中使用按钮在一个轴上制作了2个图,第一个图是线图
这是情节
http://i1275.photobucket.com/albums/y443/Kaito_Aokage/Capture2_zpsbc76be37.png?t=1403148417
线图的代码
% X
for i = 1.5:7;
    cur_x = i * 3.8;
    line([cur_x, cur_x], [0 5], 'color', 'r', 'LineWidth', 1.5);
    drawnow;
end;

% Y
for i = 2:7;
    cur_y = i * 4;
    line([0 4],[cur_y, cur_y], 'color', 'r', 'LineWidth', 1.5);
    drawnow;
end;

% X2
for i = 1.5:7;
    cur_x2 = i * 3.8;
    line([cur_x2, cur_x2], [25 31], 'color', 'r', 'LineWidth', 1.5);
    drawnow;
end;

% Y2
for i = 1:8;
    cur_y2 = i * 3.5;
    line([26 31],[cur_y2, cur_y2], 'color', 'r', 'LineWidth', 1.5);
    drawnow;
end;

% X
line( [5.7 cur_x], [5 5], 'color', 'r', 'LineWidth', 1.5);

% Y
line( [4 4], [8 cur_y], 'color', 'r', 'LineWidth', 1.5);

% X2
line( [5.6 cur_x2], [25 25], 'color', 'r', 'LineWidth', 1.5);

% Y2
line( [26 26], [3.5 cur_y2], 'color', 'r', 'LineWidth', 1.5);

handles.axes2;
grid on;
hold on;
axis([0 30 0 30]);
,第二个图是轮廓图
http://i1275.photobucket.com/albums/y443/Kaito_Aokage/Capture3_zpsfd46dedf.png?t=1403148576
等高线图的代码
xMove = 3;
yMove = 10;
r = 30;
rx = -r:0.1:r;
ry = r:-0.1:-r;
[x_coor, y_coor] = meshgrid(rx, ry);
radius = sqrt(x_coor.^2+y_coor.^2);
contourf(x_coor + xMove, y_coor + yMove, radius,'edgecolor','none');
xlabel('Widht');
ylabel('Long');
axis([0 30 0 30]);
colorbar;
caxis([0 10]);
grid on;
handles.axes2;
set(gca,'layer','top');
hold on;
按钮楼层是线图,按钮AP1是等高线图。当我尝试在线图按钮后按下绘图轮廓按钮时,线图与轮廓图重叠。我希望线图不会被轮廓图重叠,因此在按下轮廓图按钮后可以看到线图。我已经尝试hold或set(gca,'layer','top),但它不起作用。我该怎么办?
1 个答案:
答案 0 :(得分:0)
您执行上述代码的顺序是什么?我先执行第二个代码,然后是第一个代码,这是我的输出
这是我执行的整个代码,我不得不删除行handle.axis2;,因为它抛出错误。(我使用的是matlab 2011)
close all
xMove = 3;
yMove = 10;
r = 30;
rx = -r:0.1:r;
ry = r:-0.1:-r;
[x_coor, y_coor] = meshgrid(rx, ry);
radius = sqrt(x_coor.^2+y_coor.^2);
contourf(x_coor + xMove, y_coor + yMove, radius,'edgecolor','none');
xlabel('Widht');
ylabel('Long');
axis([0 30 0 30]);
colorbar;
caxis([0 10]);
grid on;
set(gca,'layer','top');
hold on;
% X
for i = 1.5:7;
    cur_x = i * 3.8;
    line([cur_x, cur_x], [0 5], 'color', 'r', 'LineWidth', 1.5);
    drawnow;
end;

% Y
for i = 2:7;
    cur_y = i * 4;
    line([0 4],[cur_y, cur_y], 'color', 'r', 'LineWidth', 1.5);
    drawnow;
end;

% X2
for i = 1.5:7;
    cur_x2 = i * 3.8;
    line([cur_x2, cur_x2], [25 31], 'color', 'r', 'LineWidth', 1.5);
    drawnow;
end;

% Y2
for i = 1:8;
    cur_y2 = i * 3.5;
    line([26 31],[cur_y2, cur_y2], 'color', 'r', 'LineWidth', 1.5);
    drawnow;
end;

% X
line( [5.7 cur_x], [5 5], 'color', 'r', 'LineWidth', 1.5);

% Y
line( [4 4], [8 cur_y], 'color', 'r', 'LineWidth', 1.5);

% X2
line( [5.6 cur_x2], [25 25], 'color', 'r', 'LineWidth', 1.5);

% Y2
line( [26 26], [3.5 cur_y2], 'color', 'r', 'LineWidth', 1.5);


grid on;

axis([0 30 0 30]);
hold off;
相关问题
最新问题
- 我写了这段代码,但我无法理解我的错误
- 我无法从一个代码实例的列表中删除 None 值,但我可以在另一个实例中。为什么它适用于一个细分市场而不适用于另一个细分市场?
- 是否有可能使 loadstring 不可能等于打印?卢阿
- java中的random.expovariate()
- Appscript 通过会议在 Google 日历中发送电子邮件和创建活动
- 为什么我的 Onclick 箭头功能在 React 中不起作用?
- 在此代码中是否有使用“this”的替代方法?
- 在 SQL Server 和 PostgreSQL 上查询,我如何从第一个表获得第二个表的可视化
- 每千个数字得到
- 更新了城市边界 KML 文件的来源?