我有一个称为“ bound”的df,具有不同时间间隔(9_10,10_11,11_12 =列名)的值(我发现了多少只动物)。最后两行是该间隔内的空气温度的平均值和标准偏差,取自另一个df。
9_10   10_11   11_12
2.1     5.1      NA
4.23    2.1      9.2
NA      3.2      5.6
18.56   20.45    23.56
5.67    5.12     5.78
我的df更长了。
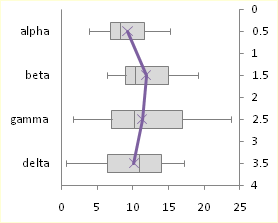
现在,我想制作一个箱线图,其中的列名称定义了x轴,而箱是由找到的动物的值制成的。平均值应打印为一条线(也许带有第二个y轴),而sd作为误差线。尽管行将位于框线之外,但它们却以某种方式出现,因为它们并非源自相同的数据:
https://peltiertech.com/images/2011-06/BoxPlotH5a.png (对不起,不知何故我不能在此处发布图片)
Alpha,beta等应为9_10、10_11等。
我已经尝试了此方法(以及其他方法):
t <- ggplot(stack(bound[1:3,]), aes(x=ind, y=values))
t <- t + geom_boxplot(outlier.shape=NA,fill="grey", color="black")
t <- t + coord_cartesian(ylim = c(0, 20))
t <- t + scale_x_discrete(name = NULL, labels=c("09:00 - 09:59","10:00 - 10:59","11:00 - 11:59"))
t <- t + scale_y_continuous(name = "animals found per hour")
t <- t + geom_line(stack(bound[4,]),aes(x=ind, y=values))
t <- t + scale_y_continuous(sec.axis = sec_axis(~.), name = "mean air temperature")
此代码为我提供了一个很好的箱线图,就像我希望它能找到包含动物数量的行一样。但是空气温度线没有出现,我也不知道ggplot是否能够做到这一点。在我看来,它似乎在方框图中垂直地绘制了一条线,而在方框图中未水平地绘制了一条线。
有人可以帮助我吗?
答案 0 :(得分:0)
有两个问题:
geom_line data=,并且数据集与原始ggplot中的数据集不同希望这会有所帮助
编辑:将来,请尝试使用函数dput(bound)来捕获代码中的数据集,以便发布到SO:)
# data
library(ggplot2)
input <- c(2.1,     5.1  ,    NA,
           4.23,    2.1   ,   9.2,
           NA  ,    3.2   ,   5.6,
           18.56,   20.45 ,   23.56,
           5.67 ,   5.12  ,   5.78)
bound <- data.frame(matrix(input, ncol=3, byrow = TRUE))
names(bound) <- c("9_10", "10_11", "11_12")

t <- ggplot(stack(bound[1:3,]), aes(x=ind, y=values))
t <- t + geom_boxplot(outlier.shape=NA,fill="grey", color="black")
t <- t + coord_cartesian(ylim = c(0, 20))
t <- t + scale_x_discrete(name = NULL, labels=c("09:00 - 09:59","10:00 - 10:59","11:00 - 11:59"))
t <- t + scale_y_continuous(name = "animals found per hour")

# extract the bound[4,]
error_bars <- stack(bound[4,])
# replace with your formulation e.g. looks like negative binomial maybe?
error_bars$low <- error_bars$values-1.96*unlist(bound[5,])
error_bars$upp <- error_bars$values+1.96*unlist(bound[5,])

# two issues
# 1. the column ind will have values "9_10" which aren't numeric scale
#    boxplots have factor levels on x axis. The levels by default will be numeric
#    vector starting at 1,2,3 etc.
#    Try replacing ind with these factor levels
error_bars$ind <- 1:3


# 2. best practice to add data=line_df, as without it, ggplot throws a tantrum
# if you've specified a different data set in the original ggplot
t <- t + geom_line(data=error_bars, aes(x=ind, y=values)) +
  geom_errorbar(data=error_bars, aes(ymin=low, ymax=upp), colour="indianred2")
t <- t + scale_y_continuous(sec.axis = sec_axis(~), name = "mean air temperature")
t <- t + theme_minimal()
# can now see the line
t