Postgres异常高磁盘I / O +慢AJAX调用
我正在使用Ubuntu 16.04和PostgreSQL 9.5以及Django 1.11
我的网站遭遇了超长的ajax通话(2-20秒)。相同的ajax调用在开发过程中需要大约100-500ms。该问题似乎不是服务器或代码问题,因此很可能是数据库。
我的开发和发展之间的主要区别生产环境是我使用Windows进行开发,Ubuntu 16.04用于生产。
我注意到服务器会遇到超高磁盘I / O,只需要几个查询。
这是一张照片
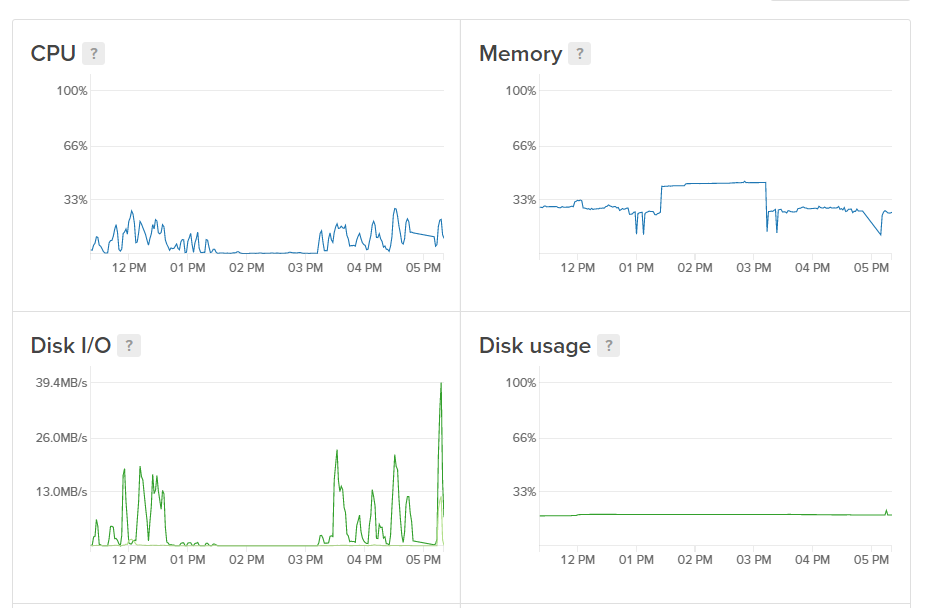 。
。
如您所见,一些查询可以将磁盘I / O驱动到40MB / s。这似乎不正常。
数据库具有可以查询的字段的索引。
慢速ajax调用与异常高磁盘I / O相关似乎是合理的。可能导致这种情况的原因是什么?
修改
一直需要25秒的查询语句:
EXPLAIN (ANALYZE, BUFFERS)
SELECT COUNT(*) AS "__count" FROM "map_listing"
WHERE ("map_listing"."lo" <  -79.32516245458987 AND "map_listing"."la" > 43.640279060122346
AND "map_listing"."lo" >  -79.60531382177737 AND "map_listing"."transaction_type" = 'Sale'
AND "map_listing"."la" < 43.774544561921296
AND NOT ("map_listing"."status" = 'Sld' AND "map_listing"."sold_date" < '2018-01-21'::date
AND "map_listing"."sold_date" IS NOT NULL)
AND NOT (("map_listing"."status" = 'Ter' OR "map_listing"."status" = 'Exp'))
AND NOT (("map_listing"."property_type" = 'Parking Space' OR "map_listing"."property_type" = 'Locker')));
来自pg_stat_statements的结果:
userid              | 16385
dbid                | 19402
queryid             | 116800687
query               | SELECT COUNT(*) AS "__count" FROM "map_listing" WHERE ("map_listing"."lo" <  ? AND "map_listing"."la" > ? AND "map_listing"."lo" >  ? AND "map_listing"."transaction_type" = ? AND "map_listing"."la" < ? AND NOT ("map_listing"."status" = ? AND "map_listing"."sold_date" < ?::date AND "map_listing"."sold_date" IS NOT NULL) AND NOT (("map_listing"."status" = ? OR "map_listing"."status" = ?)) AND NOT (("map_listing"."property_type" = ? OR "map_listing"."property_type" = ?)))
calls               | 4
total_time          | 51397.771
min_time            | 277.512
max_time            | 25313.785
mean_time           | 12849.44275
stddev_time         | 11364.6279845798
rows                | 4
shared_blks_hit     | 31954
shared_blks_read    | 147159
shared_blks_dirtied | 0
shared_blks_written | 0
local_blks_hit      | 0
local_blks_read     | 0
local_blks_dirtied  | 0
local_blks_written  | 0
temp_blks_read      | 0
temp_blks_written   | 0
blk_read_time       | 0
blk_write_time      | 0
EXPLAIN (ANALYZE, BUFFERS) ..statement..的结果:
 Aggregate  (cost=89924.55..89924.56 rows=1 width=0) (actual time=27318.859..27318.860 rows=1 loops=1)
   Buffers: shared read=73424
   ->  Bitmap Heap Scan on map_listing  (cost=4873.96..89836.85 rows=35079 width=0) (actual time=6061.214..27315.183 rows=3228 loops=1)
         Recheck Cond: ((la > 43.640279060122346) AND (la < 43.774544561921296))
         Rows Removed by Index Recheck: 86733
         Filter: ((lo < '-79.32516245458987'::numeric) AND (lo > '-79.60531382177737'::numeric) AND ((status)::text <> 'Ter'::text) AND ((status)::text <> 'Exp'::text) AND ((property_type)::text <> 'Parking Space'::text) AND ((property_type)::text <> 'Locker'::text) AND ((transaction_type)::text = 'Sale'::text) AND (((status)::text <> 'Sld'::text) OR (sold_date >= '2018-01-21'::date) OR (sold_date IS NULL)))
         Rows Removed by Filter: 190108
         Heap Blocks: exact=46091 lossy=26592
         Buffers: shared read=73424
         ->  Bitmap Index Scan on map_listing_la_88ca396c  (cost=0.00..4865.19 rows=192477 width=0) (actual time=156.964..156.964 rows=194434 loops=1)
               Index Cond: ((la > 43.640279060122346) AND (la < 43.774544561921296))
               Buffers: shared read=741
 Planning time: 0.546 ms
 Execution time: 27318.926 ms
(14 rows)
1 个答案:
答案 0 :(得分:0)
使用pg_stat_statements查找占用时间最多的查询。使用EXPLAIN (ANALYZE, BUFFERS)找出查询需要很长时间的原因。
相关问题
最新问题
- 我写了这段代码,但我无法理解我的错误
- 我无法从一个代码实例的列表中删除 None 值,但我可以在另一个实例中。为什么它适用于一个细分市场而不适用于另一个细分市场?
- 是否有可能使 loadstring 不可能等于打印?卢阿
- java中的random.expovariate()
- Appscript 通过会议在 Google 日历中发送电子邮件和创建活动
- 为什么我的 Onclick 箭头功能在 React 中不起作用?
- 在此代码中是否有使用“this”的替代方法?
- 在 SQL Server 和 PostgreSQL 上查询,我如何从第一个表获得第二个表的可视化
- 每千个数字得到
- 更新了城市边界 KML 文件的来源?