在相关矩阵中包裹轴标签
我尝试使用ggcorr() function within library(GGally)创建关联矩阵。该软件包按预期工作,但我遇到了一个问题,我想编辑轴标签在图上的显示方式。
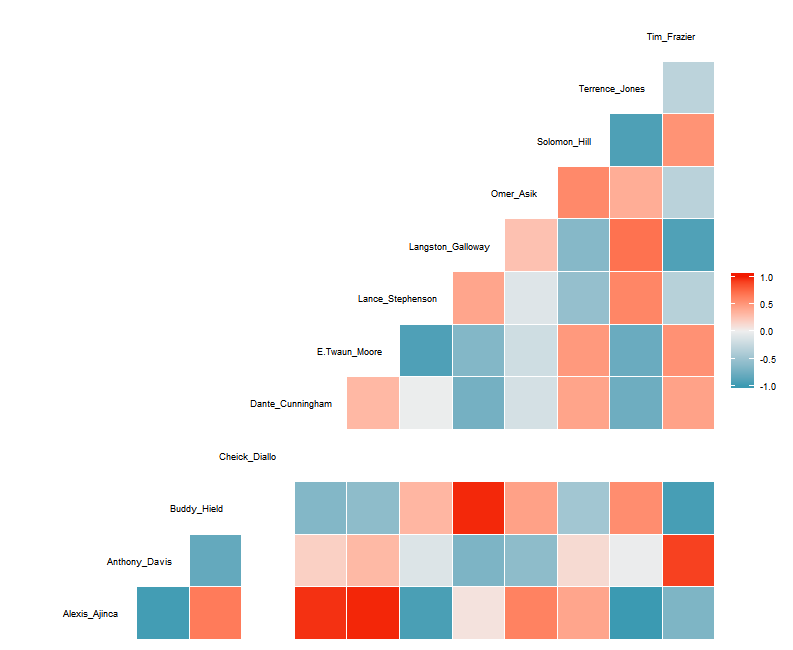
目前,他们会自动添加_或。用空格或它们之间的其他字符分隔名称。理想情况下,我想在名称中的空格之间创建换行符(\ n),以便可以轻松读取长名称和短名称,并且不会超出相应的列和行。
我找到了其他人在SO上使用过的解决方案,包括使用str_wrap(),但它是在ggplot()调用内,而不是此特定包。我已经检查了the R code for the package,但无法找到具体编辑这些标签的位置。每当我尝试编辑X或Y轴文本时,它都会添加一个全新的轴和一组标签。
我目前dcast()数据框已生成数据框,即使我gsub()" \ n"进入播放器名称列后,它们会在dcast()转换中丢失。
这是我正在使用的一个例子。我希望能够在标签的名字和姓氏之间自动创建换行符。
library(GGally)
library(ggplot2)

test <- structure(list(Date = structure(c(17100, 17102, 17103, 17106,
17107), class = "Date"), `Alexis Ajinca` = c(1.2, NA, 9.2, 6.4,
NA), `Anthony Davis` = c(95.7, 76.9, 29, 67, 24.9), `Buddy Hield` = c(9.7,
4.7, 17, 8, 28.3), `Cheick Diallo` = c(NA, NA, 3.2, NA, NA),
    `Dante Cunningham` = c(0.5, 27.6, 14, 13.5, -1), `E'Twaun Moore` = c(19.2,
    16.1, 22, 20.5, 10.1), `Lance Stephenson` = c(16.1, 31.6,
    8, 8.1, 34.8), `Langston Galloway` = c(10.9, 2, 13.8, 2.2,
    29.4), `Omer Asik` = c(4.7, 6.6, 9.9, 15.9, 14.2), `Solomon Hill` = c(4.7,
    13.2, 12.8, 35.2, 4.4), `Terrence Jones` = c(17.1, 12.4,
    9.8, NA, 20.8), `Tim Frazier` = c(40.5, 40.2, 18.3, 44.1,
    7.2)), .Names = c("Date", "Alexis Ajinca", "Anthony Davis",
"Buddy Hield", "Cheick Diallo", "Dante Cunningham", "E'Twaun Moore",
"Lance Stephenson", "Langston Galloway", "Omer Asik", "Solomon Hill",
"Terrence Jones", "Tim Frazier"), row.names = c(NA, -5L), class = "data.frame")

ggc <- ggcorr(test[,-1], method = c("pairwise","pearson"),
       hjust = .85, size = 3,
       layout.exp=2)
ggc
感谢您提供任何帮助,如果您有任何疑问或需要澄清,请与我们联系!
1 个答案:
答案 0 :(得分:1)
几种方法
您可以编辑ggcorr
g = ggplot_build(ggc)
g$data[[2]]$label = gsub("_", "\n", g$data[[2]]$label )
grid::grid.draw(ggplot_gtable(g))
或者您可以创建新数据框并使用geom_text手动添加标签。这可能会对文本对齐和放置提供更多控制。
# I dont see how to suppress the labels so just set the size to zero
ggc <- ggcorr(test[,-1], method = c("pairwise","pearson"),
       hjust = .85,
       size = 0, # set this to zero
       layout.exp=2)

# Create labels and plot
dat <- data.frame(x = seq(test[-1]), y = seq(test[-1]),
                  lbs = gsub(" ", "\n", names(test[-1]) ))
ggc + geom_text(data=dat, aes(x, y, label=lbs), nudge_x = 2, hjust=1)
相关问题
最新问题
- 我写了这段代码,但我无法理解我的错误
- 我无法从一个代码实例的列表中删除 None 值,但我可以在另一个实例中。为什么它适用于一个细分市场而不适用于另一个细分市场?
- 是否有可能使 loadstring 不可能等于打印?卢阿
- java中的random.expovariate()
- Appscript 通过会议在 Google 日历中发送电子邮件和创建活动
- 为什么我的 Onclick 箭头功能在 React 中不起作用?
- 在此代码中是否有使用“this”的替代方法?
- 在 SQL Server 和 PostgreSQL 上查询,我如何从第一个表获得第二个表的可视化
- 每千个数字得到
- 更新了城市边界 KML 文件的来源?