在ggplot2条形图中勾选标签
我有一个简单的数据框 by_day ,我想绘制出来:
 X weekday         variable value
0       0 Number_of_tweets  5820
1       1 Number_of_tweets  6965
2       2 Number_of_tweets  7415
3       3 Number_of_tweets  6800
4       4 Number_of_tweets  5819
5       5 Number_of_tweets  1753
6       6 Number_of_tweets  1137
我可以毫无问题地获得基本情节。
daily_plot <- ggplot(data=by_day, aes(x=by_day$weekday, y=by_day$value)) +
  geom_bar(stat = "identity")
当我尝试修改值标签时出现问题。如果我这样做,我最终会在x轴的右侧留出额外的空间:
daily_plot +
  scale_x_discrete("Day of the Week", breaks = c("0","1","2","3","4","5","6"), labels=c("Mon","Tues","Wed","Th","Fri","Sat","Sun"))

如果我这样做,那么问题是条形和新标签是偏移的
daily_plot +
  scale_x_discrete("Day of the Week", breaks = c("0","1","2","3","4","5","6"),    labels=c("Mon","Tues","Wed","Th","Fri","Sat","Sun"), limits=c("0","1","2","3","4","5","6")) +
  theme(axis.title.x = element_text(vjust=-0.5), axis.title.y=element_text(vjust=0.1))

我花了很多时间浏览ggplot2文档以及StackOverflow,但找不到相同的问题。任何帮助将不胜感激。
1 个答案:
答案 0 :(得分:16)
尝试使用连续比例(因为您没有使用因子):
by_day <- data.frame(
  X=0:6,
  weekday=0:6,
  variable="Number_of_tweets",
  value=c(5820,6965,7415,6800,5819,1753,1137))

print(by_day)

##   X weekday         variable value
## 1 0       0 Number_of_tweets  5820
## 2 1       1 Number_of_tweets  6965
## 3 2       2 Number_of_tweets  7415
## 4 3       3 Number_of_tweets  6800
## 5 4       4 Number_of_tweets  5819
## 6 5       5 Number_of_tweets  1753
## 7 6       6 Number_of_tweets  1137

daily_plot <- ggplot(data=by_day, aes(x=weekday, y=value))
daily_plot <- daily_plot + geom_bar(stat = "identity")
daily_plot <- daily_plot + scale_x_continuous(breaks=0:6,
                                              labels=c("Mon","Tue","Wed","Thu","Fri","Sat","Sun"))
print(daily_plot)

(根据评论者的说法,你可以而且应该只使用不含$的列名,而我的group=不是必需的[习惯对我而言])。
此外:
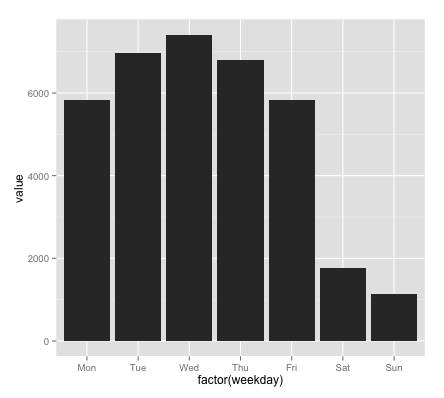
daily_plot <- ggplot(data=by_day, aes(x=factor(weekday), y=value))
daily_plot <- daily_plot + geom_bar(stat = "identity")
daily_plot <- daily_plot + scale_x_discrete(breaks=0:6,
                                            labels=c("Mon","Tue","Wed","Thu","Fri","Sat","Sun"))
print(daily_plot)
工作正常(factor() x允许您使用scale_x_discrete)
相关问题
最新问题
- 我写了这段代码,但我无法理解我的错误
- 我无法从一个代码实例的列表中删除 None 值,但我可以在另一个实例中。为什么它适用于一个细分市场而不适用于另一个细分市场?
- 是否有可能使 loadstring 不可能等于打印?卢阿
- java中的random.expovariate()
- Appscript 通过会议在 Google 日历中发送电子邮件和创建活动
- 为什么我的 Onclick 箭头功能在 React 中不起作用?
- 在此代码中是否有使用“this”的替代方法?
- 在 SQL Server 和 PostgreSQL 上查询,我如何从第一个表获得第二个表的可视化
- 每千个数字得到
- 更新了城市边界 KML 文件的来源?