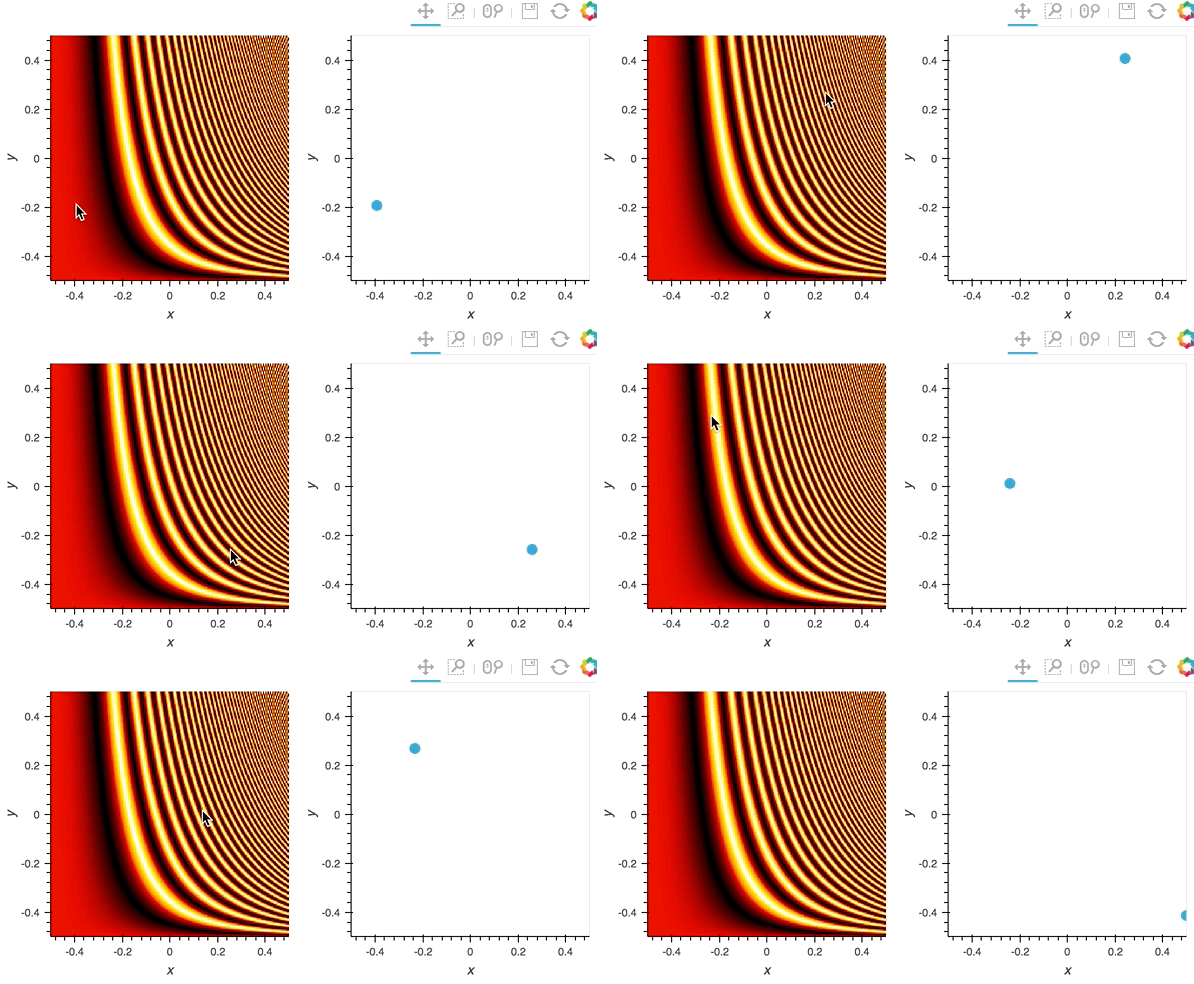
在bokeh中创建侧面板以显示悬停的数据点的详细信息
我看到了许多很好的示例,这些示例说明bokeh如何使您将鼠标悬停在数据点上并显示其弹出的详细信息。在某些情况下,细节如此庞大,以至于它确实需要一个侧面板来显示所有内容。 bokeh是否是一个足够完整的窗口小部件工具箱,我可以在其中创建主显示屏的侧面板并显示光标后的数据点的详细信息?
有人可以指出一些示例代码,或者至少指出相关的api。
2 个答案:
答案 0 :(得分:0)
您可以在https://bokeh.pydata.org上找到许多示例。通过添加回调并更新相关部分,可以实现所需的功能。在此示例中,div是您在问题中命名为侧面板的名称。
#for bokeh 1.0.4
from bokeh.plotting import figure
from bokeh.models import ColumnDataSource,Div,Row
from bokeh.io import curdoc
from bokeh.events import Tap

#the data
d={'x':[1,2],'y':[3,4],'info':['some information on a first datapoint','some information on a second datapoint']}

source=ColumnDataSource(d)
tooltips = [("x", "$x"),("y", "$y"),("info","@info")]
fig=figure(tools="tap,reset",tooltips=tooltips)
c=fig.circle('x','y',source=source,size=15)

def callback(event):
    indexActive=source.selected.indices[0]
    layout.children[1]=Div(text=d['info'][indexActive])#adjust the info on the right

fig.on_event(Tap, callback)

div=Div(text=d['info'][0])

layout=Row(fig,div)
curdoc().add_root(layout)
要运行此代码,请将其另存为code.py,打开一个cmd并键入“ bokeh serve code.py --show”。
答案 1 :(得分:0)
如果您希望使用更高级别的API来构建和链接基于散景的图,则可以使用HoloViews。请参阅http://holoviews.org/reference/index.html#streams的链接示例和http://holoviews.org/user_guide/Custom_Interactivity.html的说明。例如:
import param, numpy as np, holoviews as hv
from holoviews import opts, streams
hv.extension('bokeh')

xvals = np.linspace(0,4,202)
ys,xs = np.meshgrid(xvals, -xvals[::-1])
img = hv.Image(np.sin(((ys)**3)*xs))

pointer = streams.PointerXY(x=0,y=0, source=img)
dmap = hv.DynamicMap(lambda x, y: hv.Points([(x, y)]), streams=[pointer])
dmap = dmap.redim.range(x=(-0.5,0.5), y=(-0.5,0.5))

img + dmap.opts(size=10)
相关问题
最新问题
- 我写了这段代码,但我无法理解我的错误
- 我无法从一个代码实例的列表中删除 None 值,但我可以在另一个实例中。为什么它适用于一个细分市场而不适用于另一个细分市场?
- 是否有可能使 loadstring 不可能等于打印?卢阿
- java中的random.expovariate()
- Appscript 通过会议在 Google 日历中发送电子邮件和创建活动
- 为什么我的 Onclick 箭头功能在 React 中不起作用?
- 在此代码中是否有使用“this”的替代方法?
- 在 SQL Server 和 PostgreSQL 上查询,我如何从第一个表获得第二个表的可视化
- 每千个数字得到
- 更新了城市边界 KML 文件的来源?
