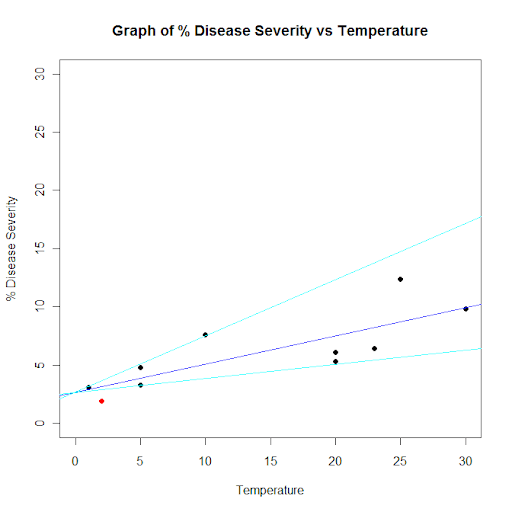
еңЁRдёӯз»ҳеҲ¶дёӨжқЎзәҝпјҢж–ңзҺҮжҳҜжңҖдҪіжӢҹеҗҲзәҝзҡ„дёӨеҖҚе’ҢдёҖеҚҠзҡ„еҖј
жҲ‘зҡ„ж•°жҚ®жңҖйҖӮеҗҲз”»зәҝгҖӮжҲ‘йңҖиҰҒз»ҳеҲ¶еҸҰеӨ–дёӨиЎҢгҖӮдёҖдёӘйңҖиҰҒжңүдёӨеҖҚзҡ„ж–ңзҺҮпјҢеҸҰдёҖдёӘйңҖиҰҒжңүдёҖеҚҠзҡ„ж–ңзҺҮгҖӮзЁҚеҗҺжҲ‘е°ҶдҪҝз”ЁиҜҘеҢәеҹҹеҜ№е…¶еӨ–йғЁзҡ„зӮ№иҝӣиЎҢе·®ејӮзқҖиүІпјҡ Conditionally colour data points outside of confidence bands in R
зӨәдҫӢж•°жҚ®йӣҶпјҡ
## Dataset from http://www.apsnet.org/education/advancedplantpath/topics/RModules/doc1/04_Linear_regression.html

## Disease severity as a function of temperature

# Response variable, disease severity
diseasesev<-c(1.9,3.1,3.3,4.8,5.3,6.1,6.4,7.6,9.8,12.4)

# Predictor variable, (Centigrade)
temperature<-c(2,1,5,5,20,20,23,10,30,25)

## For convenience, the data may be formatted into a dataframe
severity <- as.data.frame(cbind(diseasesev,temperature))

## Fit a linear model for the data and summarize the output from function lm()
severity.lm <- lm(diseasesev~temperature,data=severity)

# Take a look at the data
plot(
  diseasesev~temperature,
  data=severity,
  xlab="Temperature",
  ylab="% Disease Severity",
  pch=16,
  pty="s",
  xlim=c(0,30),
  ylim=c(0,30)
)
title(main="Graph of % Disease Severity vs Temperature")
par(new=TRUE) # don't start a new plot
abline(severity.lm, col="blue")
2 дёӘзӯ”жЎҲ:
зӯ”жЎҲ 0 :(еҫ—еҲҶпјҡ5)
дҪ еҸҜд»ҘдҪҝз”Ё
# This gets the coefficients of the linear regression (intercept and slope)
c <- coef(severity.lm)
abline(c[1], c[2]*2, col="red")
abline(c[1], c[2]/2, col="red")
зӯ”жЎҲ 1 :(еҫ—еҲҶпјҡ4)
diseasesev<-c(1.9,3.1,3.3,4.8,5.3,6.1,6.4,7.6,9.8,12.4)

# Predictor variable, (Centigrade)
temperature<-c(2,1,5,5,20,20,23,10,30,25)

## For convenience, the data may be formatted into a dataframe
severity <- as.data.frame(cbind(diseasesev,temperature))

## Fit a linear model for the data and summarize the output from function lm()
severity.lm <- lm(diseasesev~temperature,data=severity)

line1 <- severity.lm$coefficients * c(1,2)
line2 <- severity.lm$coefficients * c(1,.5)

df <- as.data.frame(severity.lm[[12]])
df2 <- adply(df,1,function(x) cbind(line1[2]*x[[2]]+line1[1], line2[2]*x[[2]]+line2[1]))

plot(
  df2[df2[,1] >= min(df2[,c(3,4)]) & df2[,1] <= max(df2[,c(3,4)]),c(2,1)],
  xlab="Temperature",
  ylab="% Disease Severity",
  pch=16,
  pty="s",
  xlim=c(0,30),
  ylim=c(0,30)
)
title(main="Graph of % Disease Severity vs Temperature")
par(new=TRUE) # don't start a new plot
abline(severity.lm, col="blue")
abline(line1, col="cyan")
abline(line2, col="cyan")
points(df2[df2[,1] < min(df2[,c(3,4)]) | df2[,1] > max(df2[,c(3,4)]),c(2,1)], pch = 16, col = 'red')
зӣёе…ій—®йўҳ
- еңЁRдёӯз»ҳеҲ¶дёӨжқЎзәҝпјҢж–ңзҺҮжҳҜжңҖдҪіжӢҹеҗҲзәҝзҡ„дёӨеҖҚе’ҢдёҖеҚҠзҡ„еҖј
- з»ҳеҲ¶жңҖдҪіиҙҙеҗҲзәҝTeeChartпјҲDelphiпјү
- жҜ”иҫғдёӨжқЎзӣҙзәҝзҡ„ж–ңзҺҮ
- rзЁӢеәҸдёӨдёӘж•ЈзӮ№еӣҫжңҖдҪіжӢҹеҗҲзәҝ
- д»ҺImageJйҖүжӢ©
- и®Ўз®—дёӨзӮ№д№Ӣй—ҙзҡ„ж–ңзҺҮ
- з”»еҚҠдёӘж— йҷҗзҡ„зәҝпјҹ
- Rпјҡз»ҳеҲ¶дёҺеҸӮиҖғзәҝвҖңйҖӮеҗҲвҖқзӣёеҗҢеҪўзҠ¶зҡ„зәҝжқЎ
- еҚҠжӯЈеёёжғ…иҠӮ
- жңҖдҪіжӢҹеҗҲзҡ„еӨҡе…ғеӣһеҪ’зәҝ
жңҖж–°й—®йўҳ
- жҲ‘еҶҷдәҶиҝҷж®өд»Јз ҒпјҢдҪҶжҲ‘ж— жі•зҗҶи§ЈжҲ‘зҡ„й”ҷиҜҜ
- жҲ‘ж— жі•д»ҺдёҖдёӘд»Јз Ғе®һдҫӢзҡ„еҲ—иЎЁдёӯеҲ йҷӨ None еҖјпјҢдҪҶжҲ‘еҸҜд»ҘеңЁеҸҰдёҖдёӘе®һдҫӢдёӯгҖӮдёәд»Җд№Ҳе®ғйҖӮз”ЁдәҺдёҖдёӘз»ҶеҲҶеёӮеңәиҖҢдёҚйҖӮз”ЁдәҺеҸҰдёҖдёӘз»ҶеҲҶеёӮеңәпјҹ
- жҳҜеҗҰжңүеҸҜиғҪдҪҝ loadstring дёҚеҸҜиғҪзӯүдәҺжү“еҚ°пјҹеҚўйҳҝ
- javaдёӯзҡ„random.expovariate()
- Appscript йҖҡиҝҮдјҡи®®еңЁ Google ж—ҘеҺҶдёӯеҸ‘йҖҒз”өеӯҗйӮ®д»¶е’ҢеҲӣе»әжҙ»еҠЁ
- дёәд»Җд№ҲжҲ‘зҡ„ Onclick з®ӯеӨҙеҠҹиғҪеңЁ React дёӯдёҚиө·дҪңз”Ёпјҹ
- еңЁжӯӨд»Јз ҒдёӯжҳҜеҗҰжңүдҪҝз”ЁвҖңthisвҖқзҡ„жӣҝд»Јж–№жі•пјҹ
- еңЁ SQL Server е’Ң PostgreSQL дёҠжҹҘиҜўпјҢжҲ‘еҰӮдҪ•д»Һ第дёҖдёӘиЎЁиҺ·еҫ—第дәҢдёӘиЎЁзҡ„еҸҜи§ҶеҢ–
- жҜҸеҚғдёӘж•°еӯ—еҫ—еҲ°
- жӣҙж–°дәҶеҹҺеёӮиҫ№з•Ң KML ж–Ү件зҡ„жқҘжәҗпјҹ