使用Regularpolycollection在Python中创建六边形网格(u矩阵)
我正在尝试创建一个六边形网格,使用RegularPolyCollection(见下面的代码)在Python(3.4)中使用u矩阵,并遇到两个问题:
-
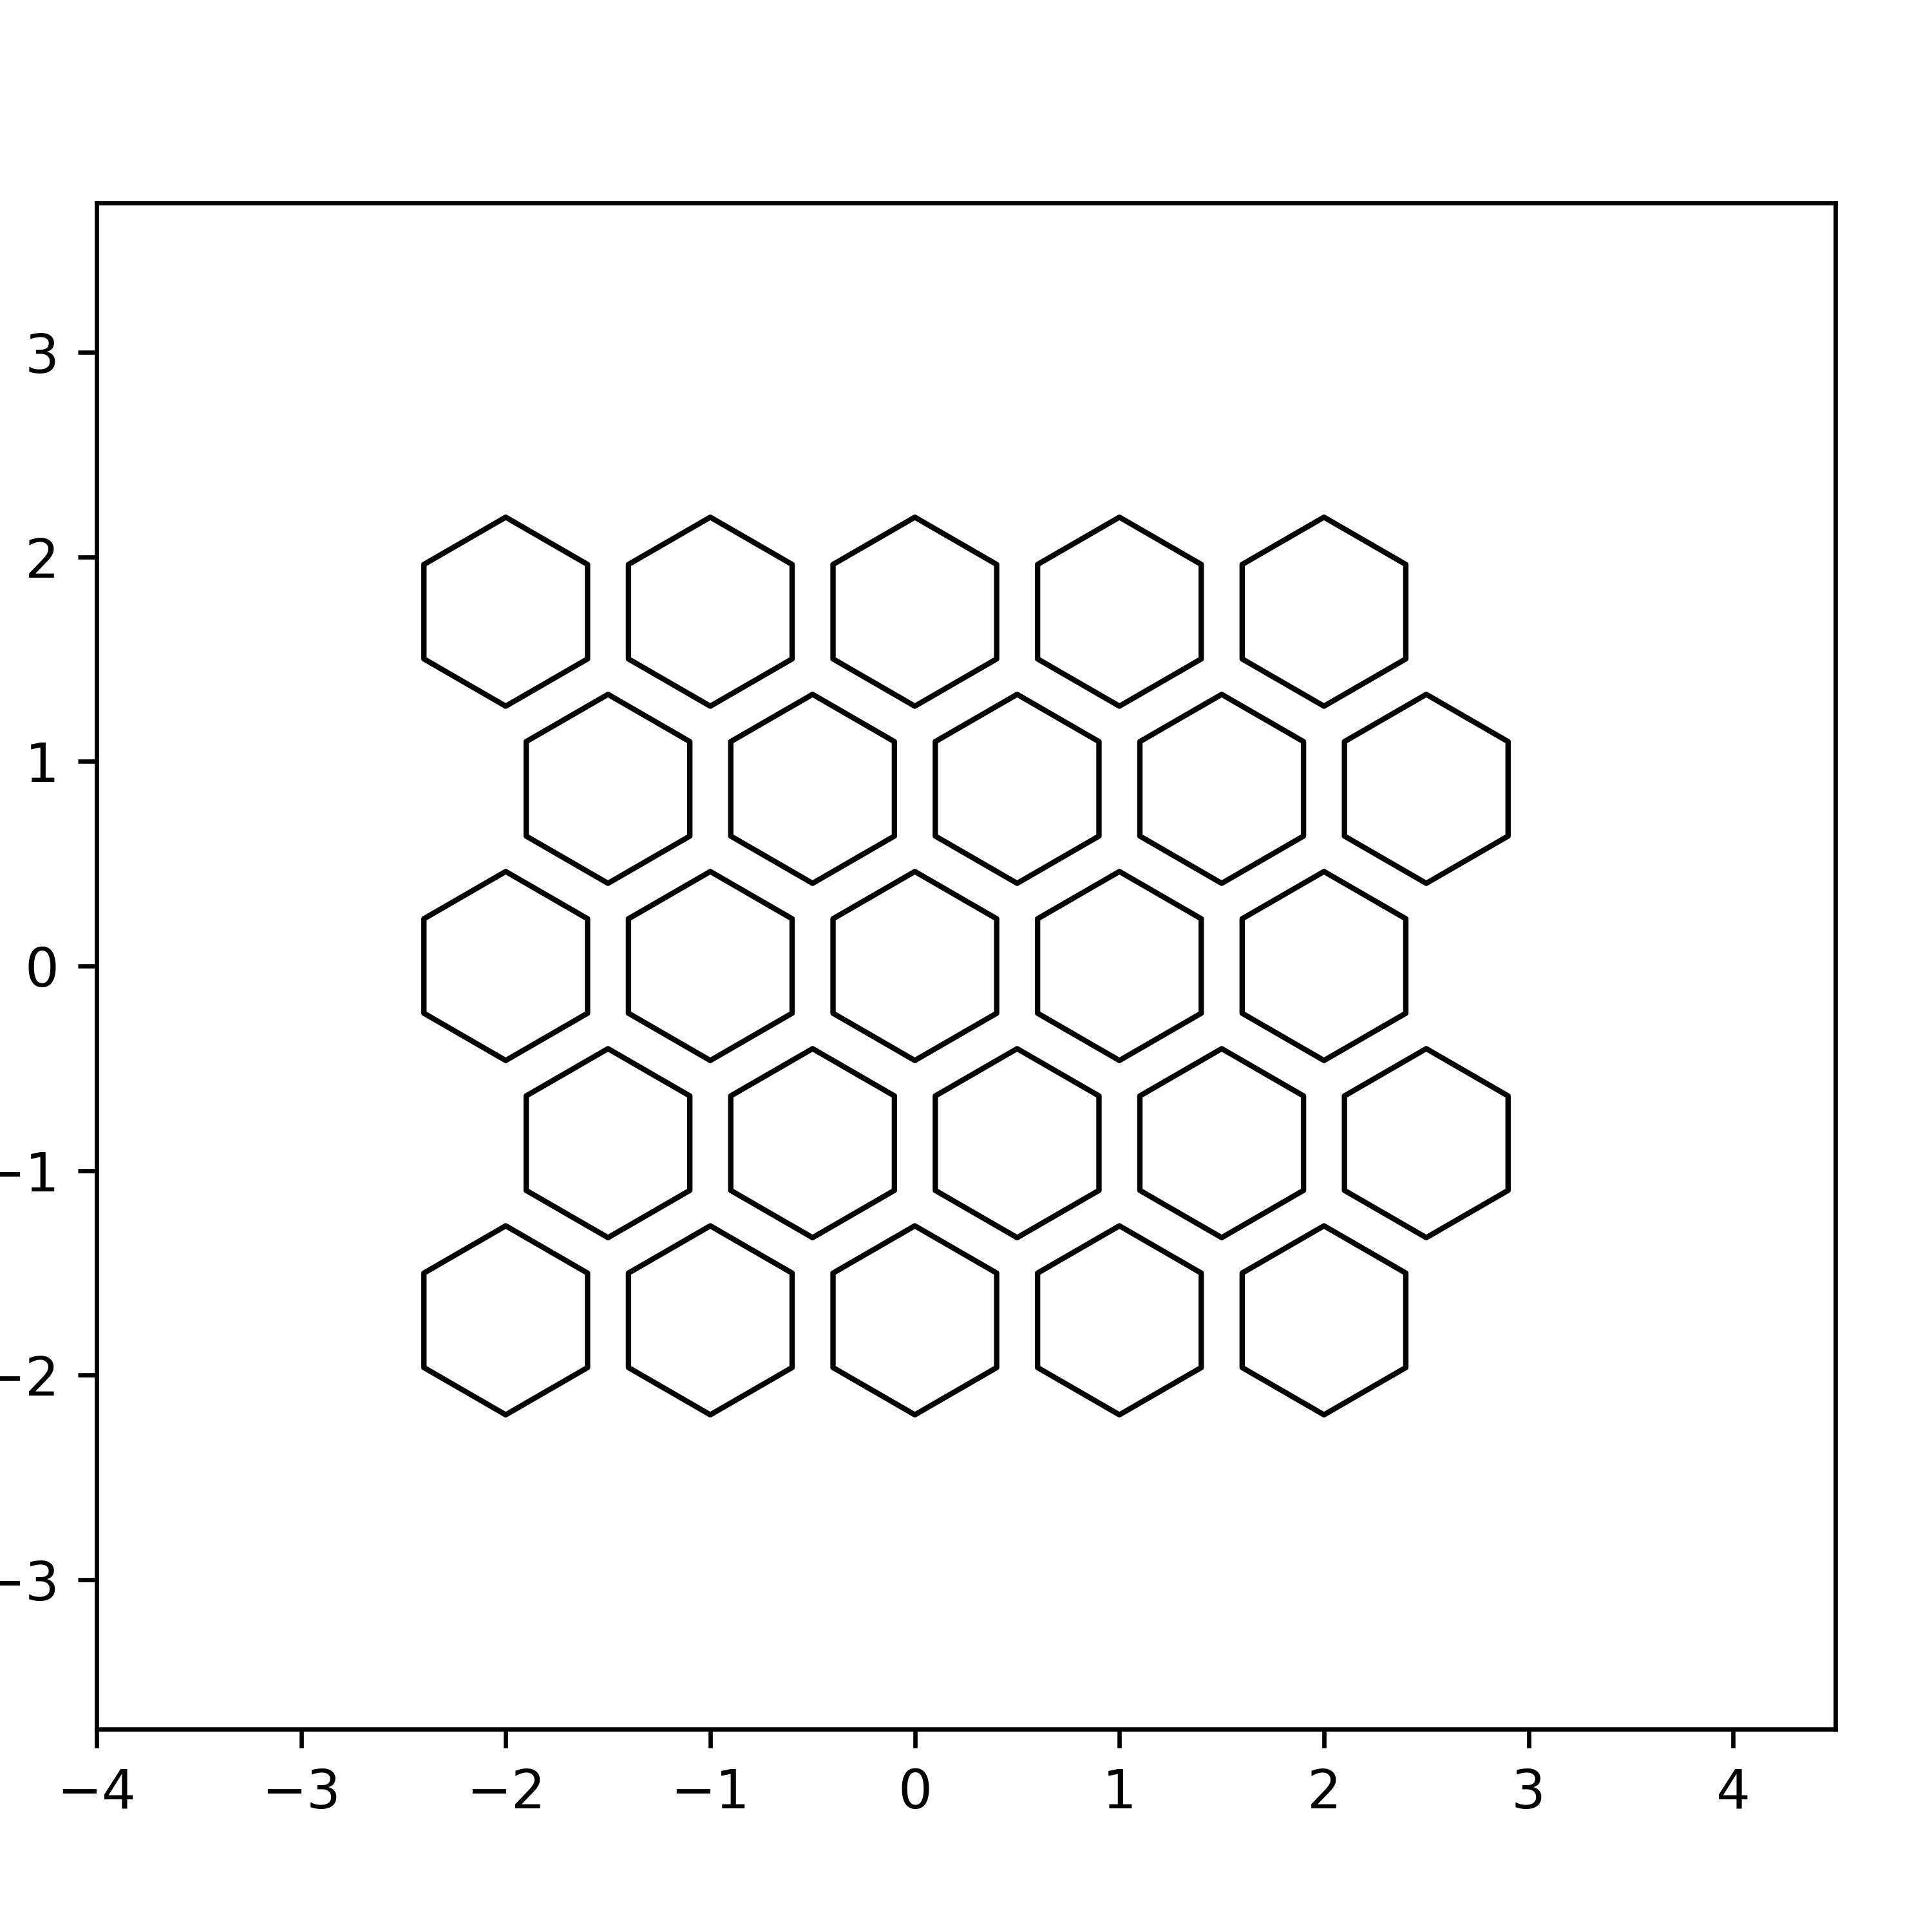
六边形网格不紧。当我绘制它时,六边形之间有空的空间。我可以通过调整窗口大小来解决这个问题,但由于这是不可重现的,并且我希望我的所有绘图都具有相同的大小,因此这并不令人满意。但即便如此,我也遇到了第二个问题。
-
顶部或右侧六边形不适合图中并被裁剪。
我尝试过很多东西(改变图形大小,subplot_adjust(),不同区域,d的不同值等等),我开始变得疯狂!感觉解决方案应该很简单,但我根本找不到它!
import SOM
import matplotlib.pyplot as plt
from matplotlib.collections import RegularPolyCollection
import numpy as np
import matplotlib.cm as cm
from mpl_toolkits.axes_grid1 import make_axes_locatable

m = 3   # The height
n = 3   # The width

# Some maths regarding hexagon geometry
d = 10
s = d/(2*np.cos(np.pi/3))
h = s*(1+2*np.sin(np.pi/3))
r = d/2
area = 3*np.sqrt(3)*s**2/2

# The center coordinates of the hexagons are calculated.
x1 = np.array([d*x for x in range(2*n-1)])
x2 = x1 + r
x3 = x2 + r
y = np.array([h*x for x in range(2*m-1)])
c = []

for i in range(2*m-1):
    if i%4 == 0:
        c += [[x,y[i]] for x in x1]
    if (i-1)%2 == 0:
        c += [[x,y[i]] for x in x2]
    if (i-2)%4 == 0:
        c += [[x,y[i]] for x in x3]
c = np.array(c)

# The color of the hexagons
d_matrix = np.zeros(3*3)

# Creating the figure
fig = plt.figure(figsize=(5, 5), dpi=100)
ax = fig.add_subplot(111)

# The collection
coll = RegularPolyCollection(
    numsides=6,  # a hexagon
    rotation=0,
    sizes=(area,),
    edgecolors = (0, 0, 0, 1),
    array= d_matrix,
    cmap = cm.gray_r,
    offsets = c,
    transOffset = ax.transData,
)

ax.add_collection(coll, autolim=True)
ax.axis('off')
ax.autoscale_view()
plt.show()
2 个答案:
答案 0 :(得分:1)
您还需要在轴上添加比例 ax.axis([xmin,xmax,ymin,ymax])
答案 1 :(得分:0)
python的hexalattice模块(pip install hexalattice)为您所关注的问题提供了解决方案:
-
网格紧密度:您可以通过'plotting_gap'参数完全控制六边形边框间隙。
-
网格绘图考虑了网格的最终尺寸,并增加了足够的边距以避免裁切。
这是一个代码示例,演示了对间隙的控制,并将网格正确地适合了绘图窗口:
from hexalattice.hexalattice import *
create_hex_grid(nx=5, ny=5, do_plot=True)  # Create 5x5 grid with no gaps
create_hex_grid(nx=5, ny=5, do_plot=True, plotting_gap=0.2)

有关其他用法示例,更多图片和链接,请参见this answer
披露:hexalattice模块是我写的
相关问题
最新问题
- 我写了这段代码,但我无法理解我的错误
- 我无法从一个代码实例的列表中删除 None 值,但我可以在另一个实例中。为什么它适用于一个细分市场而不适用于另一个细分市场?
- 是否有可能使 loadstring 不可能等于打印?卢阿
- java中的random.expovariate()
- Appscript 通过会议在 Google 日历中发送电子邮件和创建活动
- 为什么我的 Onclick 箭头功能在 React 中不起作用?
- 在此代码中是否有使用“this”的替代方法?
- 在 SQL Server 和 PostgreSQL 上查询,我如何从第一个表获得第二个表的可视化
- 每千个数字得到
- 更新了城市边界 KML 文件的来源?